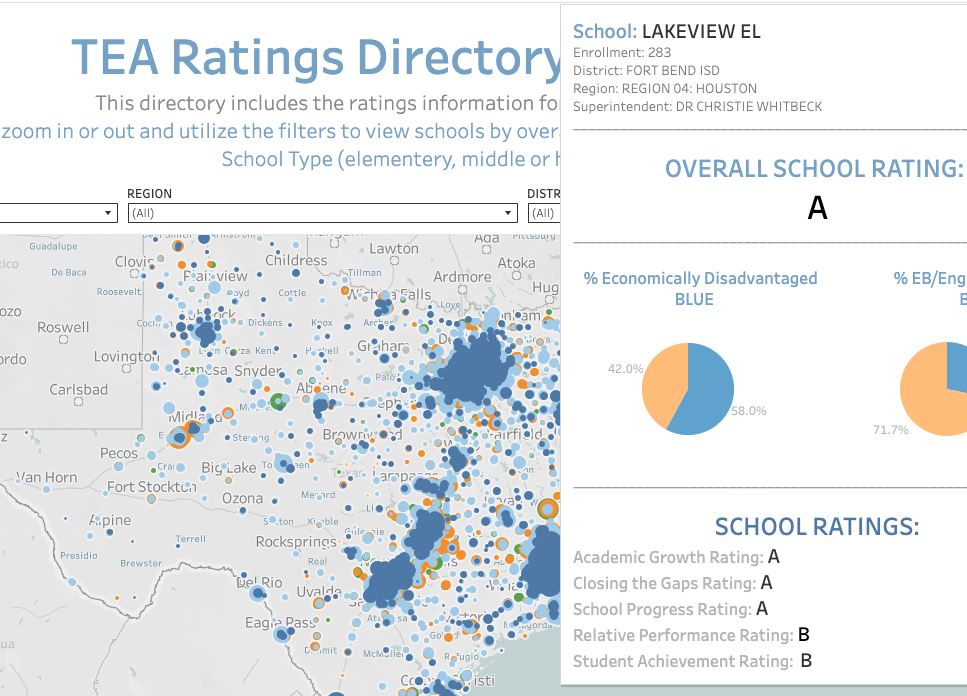
I took the data from a previous project (side by side comparison tool) and created a TEA Ratings Directory Tool 21-22 that features an interactive map of all Texas schools with a pop-up displaying each school’s rating information. The tool can by filtered by rating, region, district type and school type.
The grunt work was getting the coordinates for the map loaded and working correctly in Tableau. The great thing about this set up is that now the base map can be reutilized to show other data in the pop-up. The pop-up can also be redesigned to show other charts, visuals, etc.