
I’ve been working on the Advanced Data Visualization with Tableau course while taking breaks from 5410 and finally completed it! It is the 6th course in the Tableau Business Intelligence Analyst Professional certificate and I have 2 more to go! It has been a great course and it provided a nice (and fun!) break from the heavier mental work load of 5410. I loved the consistent structure and format in which each chart type was introduced, taught and then modeled. The course covered motion charts, dual-axis charts, gantt charts, bar-in-bar charts, donut charts, funnel charts, waterfall charts, sparkline charts, map layers, lasso/radial selection, and, polygon maps. It was intense but I hope/need to come back and practice these more slowly and create some custom versions of my own after getting through 5410! Speaking of, I got to get back to wrapping that up. Before that, here is one of my favorite chart resources out there on the wild web.
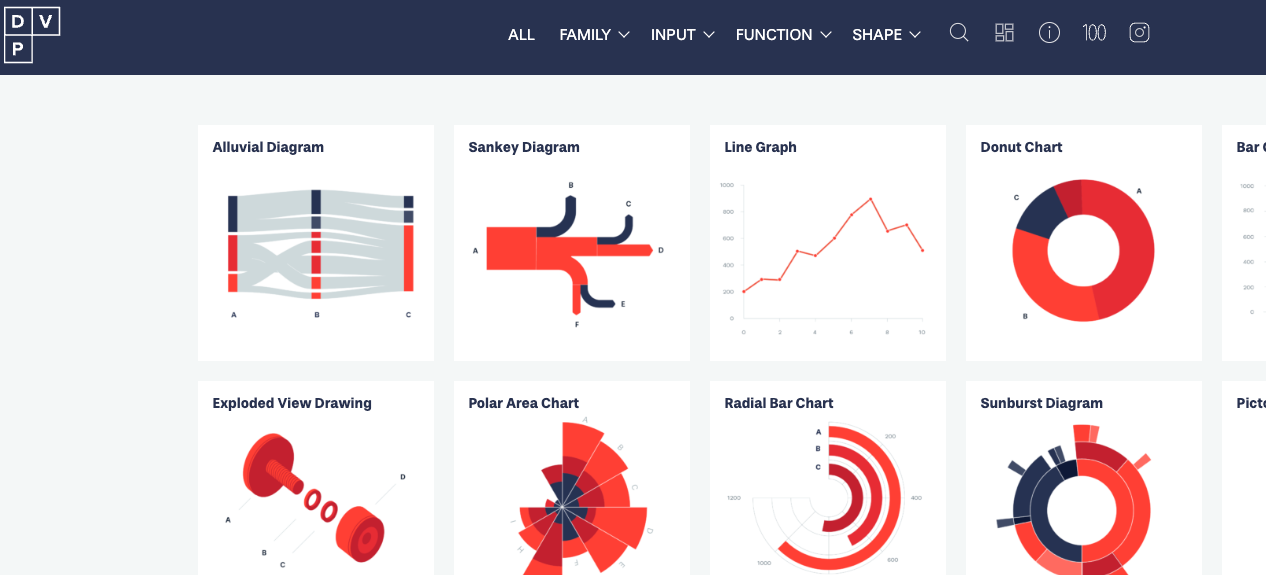
It has been super helpful and will definitely stay at the top of my data viz bookmarks.